Note
Click here to download the full example code
Tutorial 2: Using multiple datasets#
We extend the previous example to a case where we want to analyze the score of a classifier with three different MI datasets instead of just one. As before, we begin by importing all relevant libraries.
# Authors: Pedro L. C. Rodrigues, Sylvain Chevallier
#
# https://github.com/plcrodrigues/Workshop-MOABB-BCI-Graz-2019

import warnings

import matplotlib.pyplot as plt
import mne
import seaborn as sns
from mne.decoding import CSP
from sklearn.discriminant_analysis import LinearDiscriminantAnalysis as LDA
from sklearn.pipeline import make_pipeline

import moabb
from moabb.datasets import BNCI2014_001, Zhou2016
from moabb.evaluations import WithinSessionEvaluation
from moabb.paradigms import LeftRightImagery


moabb.set_log_level("info")
mne.set_log_level("CRITICAL")
warnings.filterwarnings("ignore")
Initializing Datasets#
We instantiate the two different datasets that follow the MI paradigm (with left-hand/right-hand classes) but were recorded with different number of electrodes, different number of trials, etc.
datasets = [Zhou2016(), BNCI2014_001()]
subj = [1, 2, 3]
for d in datasets:
    d.subject_list = subj
The following lines go exactly as in the previous example, where we end up obtaining a pandas dataframe containing the results of the evaluation. We could set overwrite to False to cache the results, avoiding to restart all the evaluation from scratch if a problem occurs.
paradigm = LeftRightImagery()
evaluation = WithinSessionEvaluation(
    paradigm=paradigm, datasets=datasets, overwrite=False
)
pipeline = make_pipeline(CSP(n_components=8), LDA())
results = evaluation.process({"csp+lda": pipeline})
Zhou2016-WithinSession:   0%|          | 0/3 [00:00<?, ?it/s]No hdf5_path provided, models will not be saved.
No hdf5_path provided, models will not be saved.
No hdf5_path provided, models will not be saved.

Zhou2016-WithinSession:  33%|###3      | 1/3 [00:05<00:11,  5.95s/it]No hdf5_path provided, models will not be saved.
No hdf5_path provided, models will not be saved.
No hdf5_path provided, models will not be saved.

Zhou2016-WithinSession:  67%|######6   | 2/3 [00:11<00:05,  5.51s/it]No hdf5_path provided, models will not be saved.
No hdf5_path provided, models will not be saved.
No hdf5_path provided, models will not be saved.

Zhou2016-WithinSession: 100%|##########| 3/3 [00:16<00:00,  5.32s/it]
Zhou2016-WithinSession: 100%|##########| 3/3 [00:16<00:00,  5.42s/it]

BNCI2014-001-WithinSession:   0%|          | 0/3 [00:00<?, ?it/s]
BNCI2014-001-WithinSession:   0%|          | 0/3 [00:00<?, ?it/s]
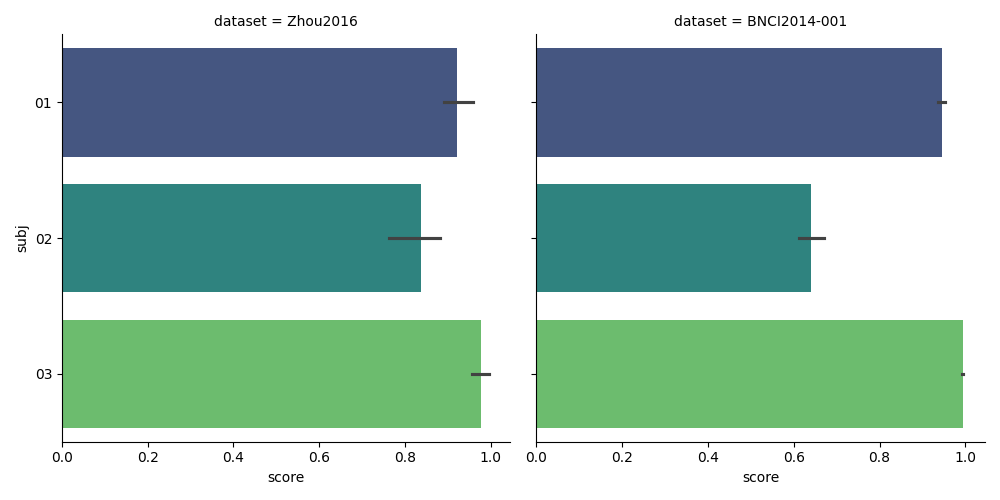
Plotting Results#
We plot the results using the seaborn library. Note how easy it is to plot the results from the three datasets with just one line.
results["subj"] = [str(resi).zfill(2) for resi in results["subject"]]
g = sns.catplot(
    kind="bar",
    x="score",
    y="subj",
    col="dataset",
    data=results,
    orient="h",
    palette="viridis",
)
plt.show()
Total running time of the script: ( 0 minutes 20.542 seconds)
Estimated memory usage: 213 MB