moabb.datasets.Wang2016#
- class moabb.datasets.Wang2016(subjects=None, sessions=None)[source]#
Bases:
BaseDataset[source]Dataset Snapshot
Wang2016
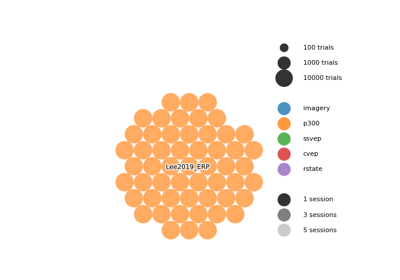
A benchmark SSVEP dataset acquired with a 40-target BCI speller using joint frequency and phase modulation (JFPM) approach
SSVEP, 40 classes
Class Labels: 8, 9, 10, 11, 12, 13, 14, 15, ...
Benchmark Context
WithinSessionIncluded in 1 MOABB benchmark table(s). Scores are across available pipelines (WithinSession accuracy).
- SSVEP all classes 6 pipelinesMax 67.52 · Median 29.39 · Mean 31.86 · Std 31.78
Citation & Impact
- Paper DOI10.1109/TNSRE.2016.2627556
- CitationsLoading…
- Public APICrossref | OpenAlex
- MOABB tables1 (WithinSession)
- Page Views30d: 34 · all-time: 510#18 of 151 · Top 12% most viewedUpdated: 2026-03-20 UTC
Stimulus Protocol
6s task window per trial · 40-class ssvep paradigm · 1 runs/session across 1 sessions
HED Event TagsHED tagsSource: MOABB BIDS HED annotation mapping.
8Sensory-eventExperimental-stimulusVisual-presentationLabel9Sensory-eventExperimental-stimulusVisual-presentationLabel10Sensory-eventExperimental-stimulusVisual-presentationLabel11Sensory-eventExperimental-stimulusVisual-presentationLabel12Sensory-eventExperimental-stimulusVisual-presentationLabel13Sensory-eventExperimental-stimulusVisual-presentationLabel14Sensory-eventExperimental-stimulusVisual-presentationLabel15Sensory-eventExperimental-stimulusVisual-presentationLabel8.2Sensory-eventExperimental-stimulusVisual-presentationLabel9.2Sensory-eventExperimental-stimulusVisual-presentationLabel10.2Sensory-eventExperimental-stimulusVisual-presentationLabel11.2Sensory-eventExperimental-stimulusVisual-presentationLabel12.2Sensory-eventExperimental-stimulusVisual-presentationLabel13.2Sensory-eventExperimental-stimulusVisual-presentationLabel14.2Sensory-eventExperimental-stimulusVisual-presentationLabel15.2Sensory-eventExperimental-stimulusVisual-presentationLabel8.4Sensory-eventExperimental-stimulusVisual-presentationLabel9.4Sensory-eventExperimental-stimulusVisual-presentationLabel10.4Sensory-eventExperimental-stimulusVisual-presentationLabel11.4Sensory-eventExperimental-stimulusVisual-presentationLabel12.4Sensory-eventExperimental-stimulusVisual-presentationLabel13.4Sensory-eventExperimental-stimulusVisual-presentationLabel14.4Sensory-eventExperimental-stimulusVisual-presentationLabel15.4Sensory-eventExperimental-stimulusVisual-presentationLabel8.6Sensory-eventExperimental-stimulusVisual-presentationLabel9.6Sensory-eventExperimental-stimulusVisual-presentationLabel10.6Sensory-eventExperimental-stimulusVisual-presentationLabel11.6Sensory-eventExperimental-stimulusVisual-presentationLabel12.6Sensory-eventExperimental-stimulusVisual-presentationLabel13.6Sensory-eventExperimental-stimulusVisual-presentationLabel14.6Sensory-eventExperimental-stimulusVisual-presentationLabel15.6Sensory-eventExperimental-stimulusVisual-presentationLabel8.8Sensory-eventExperimental-stimulusVisual-presentationLabel9.8Sensory-eventExperimental-stimulusVisual-presentationLabel10.8Sensory-eventExperimental-stimulusVisual-presentationLabel11.8Sensory-eventExperimental-stimulusVisual-presentationLabel12.8Sensory-eventExperimental-stimulusVisual-presentationLabel13.8Sensory-eventExperimental-stimulusVisual-presentationLabel14.8Sensory-eventExperimental-stimulusVisual-presentationLabel15.8Sensory-eventExperimental-stimulusVisual-presentationLabelHED tree view
Tree · 8
├─ Sensory-event ├─ Experimental-stimulus ├─ Visual-presentation └─ Label
Tree · 9
├─ Sensory-event ├─ Experimental-stimulus ├─ Visual-presentation └─ Label
Tree · 10
├─ Sensory-event ├─ Experimental-stimulus ├─ Visual-presentation └─ Label
Tree · 11
├─ Sensory-event ├─ Experimental-stimulus ├─ Visual-presentation └─ Label
Tree · 12
├─ Sensory-event ├─ Experimental-stimulus ├─ Visual-presentation └─ Label
Tree · 13
├─ Sensory-event ├─ Experimental-stimulus ├─ Visual-presentation └─ Label
Tree · 14
├─ Sensory-event ├─ Experimental-stimulus ├─ Visual-presentation └─ Label
Tree · 15
├─ Sensory-event ├─ Experimental-stimulus ├─ Visual-presentation └─ Label
Tree · 8.2
├─ Sensory-event ├─ Experimental-stimulus ├─ Visual-presentation └─ Label
Tree · 9.2
├─ Sensory-event ├─ Experimental-stimulus ├─ Visual-presentation └─ Label
Tree · 10.2
├─ Sensory-event ├─ Experimental-stimulus ├─ Visual-presentation └─ Label
Tree · 11.2
├─ Sensory-event ├─ Experimental-stimulus ├─ Visual-presentation └─ Label
Tree · 12.2
├─ Sensory-event ├─ Experimental-stimulus ├─ Visual-presentation └─ Label
Tree · 13.2
├─ Sensory-event ├─ Experimental-stimulus ├─ Visual-presentation └─ Label
Tree · 14.2
├─ Sensory-event ├─ Experimental-stimulus ├─ Visual-presentation └─ Label
Tree · 15.2
├─ Sensory-event ├─ Experimental-stimulus ├─ Visual-presentation └─ Label
Tree · 8.4
├─ Sensory-event ├─ Experimental-stimulus ├─ Visual-presentation └─ Label
Tree · 9.4
├─ Sensory-event ├─ Experimental-stimulus ├─ Visual-presentation └─ Label
Tree · 10.4
├─ Sensory-event ├─ Experimental-stimulus ├─ Visual-presentation └─ Label
Tree · 11.4
├─ Sensory-event ├─ Experimental-stimulus ├─ Visual-presentation └─ Label
Tree · 12.4
├─ Sensory-event ├─ Experimental-stimulus ├─ Visual-presentation └─ Label
Tree · 13.4
├─ Sensory-event ├─ Experimental-stimulus ├─ Visual-presentation └─ Label
Tree · 14.4
├─ Sensory-event ├─ Experimental-stimulus ├─ Visual-presentation └─ Label
Tree · 15.4
├─ Sensory-event ├─ Experimental-stimulus ├─ Visual-presentation └─ Label
Tree · 8.6
├─ Sensory-event ├─ Experimental-stimulus ├─ Visual-presentation └─ Label
Tree · 9.6
├─ Sensory-event ├─ Experimental-stimulus ├─ Visual-presentation └─ Label
Tree · 10.6
├─ Sensory-event ├─ Experimental-stimulus ├─ Visual-presentation └─ Label
Tree · 11.6
├─ Sensory-event ├─ Experimental-stimulus ├─ Visual-presentation └─ Label
Tree · 12.6
├─ Sensory-event ├─ Experimental-stimulus ├─ Visual-presentation └─ Label
Tree · 13.6
├─ Sensory-event ├─ Experimental-stimulus ├─ Visual-presentation └─ Label
Tree · 14.6
├─ Sensory-event ├─ Experimental-stimulus ├─ Visual-presentation └─ Label
Tree · 15.6
├─ Sensory-event ├─ Experimental-stimulus ├─ Visual-presentation └─ Label
Tree · 8.8
├─ Sensory-event ├─ Experimental-stimulus ├─ Visual-presentation └─ Label
Tree · 9.8
├─ Sensory-event ├─ Experimental-stimulus ├─ Visual-presentation └─ Label
Tree · 10.8
├─ Sensory-event ├─ Experimental-stimulus ├─ Visual-presentation └─ Label
Tree · 11.8
├─ Sensory-event ├─ Experimental-stimulus ├─ Visual-presentation └─ Label
Tree · 12.8
├─ Sensory-event ├─ Experimental-stimulus ├─ Visual-presentation └─ Label
Tree · 13.8
├─ Sensory-event ├─ Experimental-stimulus ├─ Visual-presentation └─ Label
Tree · 14.8
├─ Sensory-event ├─ Experimental-stimulus ├─ Visual-presentation └─ Label
Tree · 15.8
├─ Sensory-event ├─ Experimental-stimulus ├─ Visual-presentation └─ Label
Channel SummaryTotal channels64EEG64Montage10-05Sampling250 HzReferenceCzFilter{'bandpass': [0.15, 200], 'notch': 50}Notch / line50 HzThis diagram is automatically generated from MOABB metadata. Please consult the original publication to confirm the experimental protocol details.
SSVEP Wang 2016 dataset.
Dataset from [1].
This dataset gathered SSVEP-BCI recordings of 35 healthy subjects (17 females, aged 17-34 years, mean age: 22 years) focusing on 40 characters flickering at different frequencies (8-15.8 Hz with an interval of 0.2 Hz). For each subject, the experiment consisted of 6 blocks. Each block contained 40 trials corresponding to all 40 characters indicated in a random order. Each trial started with a visual cue (a red square) indicating a target stimulus. The cue appeared for 0.5 s on the screen. Subjects were asked to shift their gaze to the target as soon as possible within the cue duration. Following the cue offset, all stimuli started to flicker on the screen concurrently and lasted 5 s. After stimulus offset, the screen was blank for 0.5 s before the next trial began, which allowed the subjects to have short breaks between consecutive trials. Each trial lasted a total of 6 s. To facilitate visual fixation, a red triangle appeared below the flickering target during the stimulation period. In each block, subjects were asked to avoid eye blinks during the stimulation period. To avoid visual fatigue, there was a rest for several minutes between two consecutive blocks.
EEG data were acquired using a Synamps2 system (Neuroscan, Inc.) with a sampling rate of 1000 Hz. The amplifier frequency passband ranged from 0.15 Hz to 200 Hz. Sixty-four channels covered the whole scalp of the subject and were aligned according to the international 10-20 system. The ground was placed on midway between Fz and FPz. The reference was located on the vertex. Electrode impedances were kept below 10 KΩ. To remove the common power-line noise, a notch filter at 50 Hz was applied in data recording. Event triggers generated by the computer to the amplifier and recorded on an event channel synchronized to the EEG data.
The continuous EEG data was segmented into 6 s epochs (500 ms pre-stimulus, 5.5 s post-stimulus onset). The epochs were subsequently downsampled to 250 Hz. Thus each trial consisted of 1500 time points. Finally, these data were stored as double-precision floating-point values in MATLAB and were named as subject indices (i.e., S01.mat, …, S35.mat). For each file, the data loaded in MATLAB generate a 4-D matrix named ‘data’ with dimensions of [64, 1500, 40, 6]. The four dimensions indicate ‘Electrode index’, ‘Time points’, ‘Target index’, and ‘Block index’. The electrode positions were saved in a ‘64-channels.loc’ file. Six trials were available for each SSVEP frequency. Frequency and phase values for the 40 target indices were saved in a ‘Freq_Phase.mat’ file.
Information for all subjects was listed in a ‘Sub_info.txt’ file. For each subject, there are five factors including ‘Subject Index’, ‘Gender’, ‘Age’, ‘Handedness’, and ‘Group’. Subjects were divided into an ‘experienced’ group (eight subjects, S01-S08) and a ‘naive’ group (27 subjects, S09-S35) according to their experience in SSVEP-based BCIs.
Warning
The original dataset includes two channels labeled ‘CB1’ and ‘CB2’, which are not part of the standard 10-20 EEG montage. Although the authors of Wang2016 state that the 10-20 layout was used, the provided channel location file suggests that ‘CB1’ and ‘CB2’ may correspond approximately to ‘P9’ and ‘P10’. However, this mapping is not confirmed, and the exact locations remain uncertain.
In this implementation, we treat ‘CB1’ and ‘CB2’ as standard EEG channels, following the approach used by the authors.
Users should be aware of this ambiguity when interpreting spatial analyses or when comparing to other datasets with strictly standard montages.
References
[1]Wang, Y., Chen, X., Gao, X., & Gao, S. (2016). A benchmark dataset for SSVEP-based brain–computer interfaces. IEEE Transactions on Neural Systems and Rehabilitation Engineering, 25(10), 1746-1752. doi: 10.1109/TNSRE.2016.2627556.
from moabb.datasets import Wang2016

dataset = Wang2016()
data = dataset.get_data(subjects=[1])
print(data[1])
Dataset summary
#Subj
34
#Chan
64
#Classes
40
#Trials / class
6
Trials length
5 s
Freq
250 Hz
#Sessions
1
Participants
Population: healthy
Age: 22 (range: 17-34) years
BCI experience: 8 experienced, 27 naïve
Equipment
Amplifier: Synamps2 EEG system (Neuroscan, Inc.)
Montage: standard_1005
Reference: Cz
Preprocessing
Data state: Raw epochs extracted from continuous EEG recordings according to stimulus onsets, downsampled to 250 Hz, no digital filters applied
Steps: Epoch extraction according to stimulus onsets from event channel, Downsampling from 1000 Hz to 250 Hz, No digital filters applied in preprocessing
Notes: Data epochs include 0.5 s before stimulus onset, 5 s for stimulation, and 0.5 s after stimulus offset. Upper bound frequency of SSVEP harmonics is around 90 Hz.
Data Access
DOI: 10.1109/TNSRE.2016.2627556
Repository: BNCI Horizon 2020
Experimental Protocol
Paradigm: ssvep
Stimulus: visual flicker
- property all_subjects#
Full list of subjects available in this dataset (unfiltered).
- convert_to_bids(path=None, subjects=None, overwrite=False, format='EDF', verbose=None, generate_figures=False)[source]#
Convert the dataset to BIDS format.
Saves the raw EEG data in a BIDS-compliant directory structure. Unlike the caching mechanism (see
CacheConfig), the files produced here do not contain a processing-pipeline hash (desc-<hash>) in their names, making the output a clean, shareable BIDS dataset.- Parameters:
path (str | Path | None) – Directory under which the BIDS dataset will be written. If
Nonethe default MNE data directory is used (same default as the rest of MOABB).subjects (list of int | None) – Subject numbers to convert. If
None, all subjects insubject_listare converted.overwrite (bool) – If
True, existing BIDS files for a subject are removed before saving. Default isFalse.format (str) – The file format for the raw EEG data. Supported values are
"EDF"(default),"BrainVision", and"EEGLAB".verbose (str | None) – Verbosity level forwarded to MNE/MNE-BIDS.
generate_figures (bool) – If
True, generate interactive neural signature HTML figures in{bids_root}/derivatives/neural_signatures/. Requiresplotly(pip install moabb[interactive]). Default isFalse.
- Returns:
bids_root – Path to the root of the written BIDS dataset.
- Return type:
Examples
>>> from moabb.datasets import AlexMI
>>> dataset = AlexMI()
>>> bids_root = dataset.convert_to_bids(path='/tmp/bids', subjects=[1])
See also
CacheConfigCache configuration for
get_data().moabb.datasets.bids_interface.get_bids_rootReturn the BIDS root path.
Notes
Added in version 1.5.
- data_path(subject, path=None, force_update=False, update_path=None, verbose=None)[source]#
Get path to local copy of a subject data.
- Parameters:
subject (int) – Number of subject to use
path (None | str) – Location of where to look for the data storing location. If None, the environment variable or config parameter
MNE_DATASETS_(dataset)_PATHis used. If it doesn’t exist, the “~/mne_data” directory is used. If the dataset is not found under the given path, the data will be automatically downloaded to the specified folder.force_update (bool) – Force update of the dataset even if a local copy exists.
update_path (bool | None Deprecated) – If True, set the MNE_DATASETS_(dataset)_PATH in mne-python config to the given path. If None, the user is prompted.
verbose (bool, str, int, or None) – If not None, override default verbose level (see
mne.verbose()).
- Returns:
path – Local path to the given data file. This path is contained inside a list of length one, for compatibility.
- Return type:
- download(subject_list=None, path=None, force_update=False, update_path=None, accept=False, verbose=None)[source]#
Download all data from the dataset.
This function is only useful to download all the dataset at once.
- Parameters:
subject_list (list of int | None) – List of subjects id to download, if None all subjects are downloaded.
path (None | str) – Location of where to look for the data storing location. If None, the environment variable or config parameter
MNE_DATASETS_(dataset)_PATHis used. If it doesn’t exist, the “~/mne_data” directory is used. If the dataset is not found under the given path, the data will be automatically downloaded to the specified folder.force_update (bool) – Force update of the dataset even if a local copy exists.
update_path (bool | None) – If True, set the MNE_DATASETS_(dataset)_PATH in mne-python config to the given path. If None, the user is prompted.
accept (bool) – Accept licence term to download the data, if any. Default: False
verbose (bool, str, int, or None) – If not None, override default verbose level (see
mne.verbose()).
- get_additional_metadata(subject: str, session: str, run: str) None | DataFrame[source]#
Load additional metadata for a specific subject, session, and run.
This method is intended to be overridden by subclasses to provide additional metadata specific to the dataset. The metadata is typically loaded from an events.tsv file or similar data source.
- get_block_repetition(paradigm, subjects, block_list, repetition_list)[source]#
Select data for all provided subjects, blocks and repetitions.
subject -> session -> run -> block -> repetition
See also
BaseDataset.get_data
- get_data(subjects=None, cache_config=None, process_pipeline=None)[source]#
Return the data corresponding to a list of subjects.
The returned data is a dictionary with the following structure:
data = {'subject_id' :
            {'session_id':
                {'run_id': run}
            }
        }
subjects are on top, then we have sessions, then runs. A sessions is a recording done in a single day, without removing the EEG cap. A session is constitued of at least one run. A run is a single contiguous recording. Some dataset break session in multiple runs.
Processing steps can optionally be applied to the data using the
*_pipelinearguments. These pipelines are applied in the following order:raw_pipeline->epochs_pipeline->array_pipeline. If a*_pipelineargument isNone, the step will be skipped. Therefore, thearray_pipelinemay either receive amne.io.Rawor amne.Epochsobject as input depending on whetherepochs_pipelineisNoneor not.- Parameters:
subjects (List of int) – List of subject number
cache_config (dict | CacheConfig) – Configuration for caching of datasets. See
CacheConfigfor details.process_pipeline (Pipeline | None) – Optional processing pipeline to apply to the data. To generate an adequate pipeline, we recommend using
moabb.utils.make_process_pipelines(). This pipeline will receivemne.io.BaseRawobjects. The steps names of this pipeline should be elements ofStepType. According to their name, the steps should either return amne.io.BaseRaw, amne.Epochs, or anumpy.ndarray(). This pipeline must be “fixed” because it will not be trained, i.e. no call tofitwill be made.
- Returns:
data – dict containing the raw data
- Return type:
Dict
- property metadata: DatasetMetadata | None[source]#
Return structured metadata for this dataset.
Returns the DatasetMetadata object from the centralized catalog, or None if metadata is not available for this dataset.
- Returns:
The metadata object containing acquisition parameters, participant demographics, experiment details, and documentation. Returns None if no metadata is registered for this dataset.
- Return type:
DatasetMetadata | None
Examples
>>> from moabb.datasets import BNCI2014_001
>>> dataset = BNCI2014_001()
>>> dataset.metadata.participants.n_subjects
9
>>> dataset.metadata.acquisition.sampling_rate
250.0