moabb.analysis.plotting.meta_analysis_plot#
- moabb.analysis.plotting.meta_analysis_plot(stats_df, alg1, alg2)[source]#
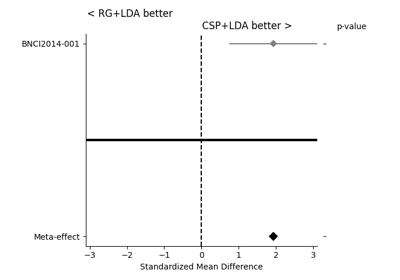
Meta-analysis to compare two algorithms across several datasets.
A meta-analysis style plot that shows the standardized effect with confidence intervals over all datasets for two algorithms. Hypothesis is that alg1 is larger than alg2
- Parameters:
stats_df (
pandas.DataFrame) – DataFrame generated by compute_dataset_statisticsalg1 (str) – Name of first pipeline
alg2 (str) – Name of second pipeline
- Returns:
fig – Pyplot handle
- Return type: