

Note
Go to the end to download the full example code.
Cross-Session Motor Imagery#
This example show how to perform a cross session motor imagery analysis on the very popular dataset 2a from the BCI competition IV.
We will compare two pipelines :
CSP+LDA
Riemannian Geometry+Logistic Regression
We will use the LeftRightImagery paradigm. This will restrict the analysis to two classes (left hand versus right hand) and use AUC as metric.
The cross session evaluation context will evaluate performance using a leave one session out cross-validation. For each session in the dataset, a model is trained on every other session and performance are evaluated on the current session.
# Authors: Alexandre Barachant <alexandre.barachant@gmail.com>
#          Sylvain Chevallier <sylvain.chevallier@uvsq.fr>
#
# License: BSD (3-clause)

import matplotlib.pyplot as plt
from mne.decoding import CSP
from pyriemann.estimation import Covariances
from pyriemann.tangentspace import TangentSpace
from sklearn.discriminant_analysis import LinearDiscriminantAnalysis as LDA
from sklearn.linear_model import LogisticRegression
from sklearn.pipeline import make_pipeline

import moabb
import moabb.analysis.plotting as moabb_plt
from moabb.analysis.chance_level import chance_by_chance
from moabb.datasets import BNCI2014_001
from moabb.evaluations import CrossSessionEvaluation
from moabb.paradigms import LeftRightImagery


moabb.set_log_level("info")
Create Pipelines#
Pipelines must be a dict of sklearn pipeline transformer.
The CSP implementation is based on the MNE implementation. We selected 8 CSP components, as usually done in the literature.
The Riemannian geometry pipeline consists in covariance estimation, tangent space mapping and finally a logistic regression for the classification.
pipelines = {}

pipelines["CSP+LDA"] = make_pipeline(CSP(n_components=8), LDA())

pipelines["RG+LR"] = make_pipeline(
    Covariances(), TangentSpace(), LogisticRegression(solver="lbfgs")
)
Evaluation#
We define the paradigm (LeftRightImagery) and the dataset (BNCI2014_001). The evaluation will return a DataFrame containing a single AUC score for each subject / session of the dataset, and for each pipeline.
Results are saved into the database, so that if you add a new pipeline, it will not run again the evaluation unless a parameter has changed. Results can be overwritten if necessary.
paradigm = LeftRightImagery()
# Because this is being auto-generated we only use 2 subjects
dataset = BNCI2014_001()
dataset.subject_list = dataset.subject_list[:2]
datasets = [dataset]
overwrite = False  # set to True if we want to overwrite cached results
evaluation = CrossSessionEvaluation(
    paradigm=paradigm, datasets=datasets, suffix="examples", overwrite=overwrite
)

results = evaluation.process(pipelines)

print(results.head())
      score      time  ... pipeline                  codecarbon_task_name
0  0.931713  0.299655  ...  CSP+LDA  8838c520-36be-4f17-adee-4772aa043dfd
1  0.955440  0.278117  ...  CSP+LDA  6da02f30-217c-4c8d-8fe3-50b16976ee02
2  0.527199  0.225999  ...  CSP+LDA  43367e6d-f842-44f2-a87c-b512de65939e
3  0.646219  0.232087  ...  CSP+LDA  f1da58e3-5b96-43bb-94d1-26ec6d975759
4  0.950424  0.156672  ...    RG+LR  62563597-2700-4ab1-9dba-dd9776fb2100

[5 rows x 13 columns]
Plot Results#
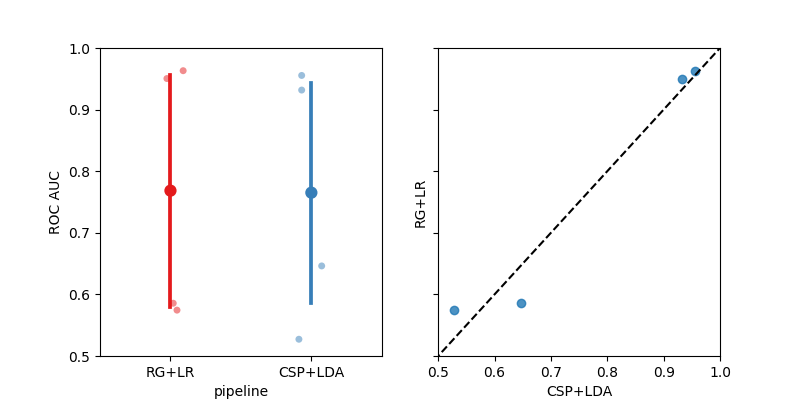
Here we plot the results using the MOABB plotting utilities with chance
level annotations. The score_plot visualizes all the data with one
score per subject for every dataset and pipeline. The paired_plot
compares two algorithms head-to-head.
chance_levels = chance_by_chance(results, alpha=[0.05, 0.01])

fig, _ = moabb_plt.score_plot(results, chance_level=chance_levels)
plt.show()
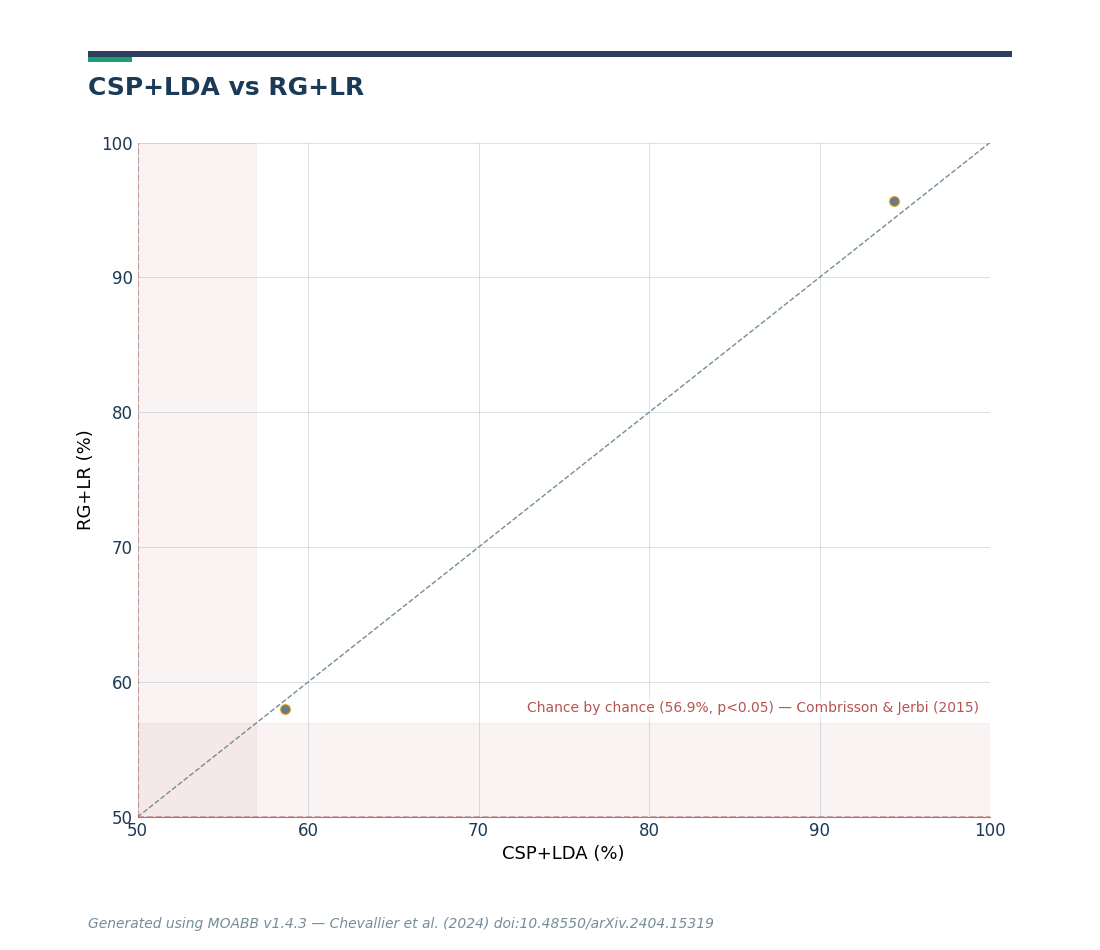
The paired plot compares CSP+LDA versus RG+LR. Each point represents the score of a single session. An algorithm outperforms the other when most points fall in its quadrant.
fig = moabb_plt.paired_plot(results, "CSP+LDA", "RG+LR", chance_level=chance_levels)
plt.show()
Total running time of the script: (0 minutes 10.408 seconds)
Run this example
