

Note
Go to the end to download the full example code.
Tutorial 2: Using multiple datasets#
We extend the previous example to a case where we want to analyze the score of a classifier with three different MI datasets instead of just one. As before, we begin by importing all relevant libraries.
# Authors: Pedro L. C. Rodrigues, Sylvain Chevallier
#
# https://github.com/plcrodrigues/Workshop-MOABB-BCI-Graz-2019

import warnings

import matplotlib.pyplot as plt
import mne
import seaborn as sns
from mne.decoding import CSP
from sklearn.discriminant_analysis import LinearDiscriminantAnalysis as LDA
from sklearn.pipeline import make_pipeline

import moabb
from moabb.datasets import BNCI2014_001, Zhou2016
from moabb.evaluations import WithinSessionEvaluation
from moabb.paradigms import LeftRightImagery


moabb.set_log_level("info")
mne.set_log_level("CRITICAL")
warnings.filterwarnings("ignore")
/home/runner/work/moabb/moabb/.venv/lib/python3.11/site-packages/optuna/integration/sklearn.py:14: FutureWarning: `optuna.integration.sklearn` has been deprecated in v4.9.0. This feature will be removed in v6.0.0. See https://github.com/optuna/optuna/releases/tag/v4.9.0. Use `optuna_integration.sklearn` instead.
  optuna_warn(f"{msg} Use `optuna_integration.sklearn` instead.", FutureWarning)
Initializing Datasets#
We instantiate the two different datasets that follow the MI paradigm (with left-hand/right-hand classes) but were recorded with different number of electrodes, different number of trials, etc.
datasets = [Zhou2016(), BNCI2014_001()]
subj = [1, 2, 3]
for d in datasets:
    d.subject_list = subj
The following lines go exactly as in the previous example, where we end up obtaining a pandas dataframe containing the results of the evaluation. We could set overwrite to False to cache the results, avoiding to restart all the evaluation from scratch if a problem occurs.
paradigm = LeftRightImagery()
evaluation = WithinSessionEvaluation(
    paradigm=paradigm, datasets=datasets, overwrite=False
)
pipeline = make_pipeline(CSP(n_components=8), LDA())
results = evaluation.process({"csp+lda": pipeline})
[codecarbon WARNING @ 23:35:37] Multiple instances of codecarbon are allowed to run at the same time.
2026-07-14 23:37:59,720 INFO MainThread moabb.evaluations.base csp+lda | Zhou2016 | 3 | 2: Score 0.994
2026-07-14 23:37:59,720 INFO MainThread moabb.evaluations.base csp+lda | Zhou2016 | 3 | 1: Score 0.982
2026-07-14 23:37:59,720 INFO MainThread moabb.evaluations.base csp+lda | Zhou2016 | 3 | 0: Score 0.952
2026-07-14 23:37:59,720 INFO MainThread moabb.evaluations.base csp+lda | Zhou2016 | 1 | 0: Score 0.853
2026-07-14 23:37:59,720 INFO MainThread moabb.evaluations.base csp+lda | Zhou2016 | 1 | 1: Score 0.906
2026-07-14 23:37:59,721 INFO MainThread moabb.evaluations.base csp+lda | Zhou2016 | 1 | 2: Score 0.948
2026-07-14 23:37:59,721 INFO MainThread moabb.evaluations.base csp+lda | Zhou2016 | 2 | 0: Score 0.910
2026-07-14 23:37:59,721 INFO MainThread moabb.evaluations.base csp+lda | Zhou2016 | 2 | 2: Score 0.906
2026-07-14 23:37:59,721 INFO MainThread moabb.evaluations.base csp+lda | Zhou2016 | 2 | 1: Score 0.760
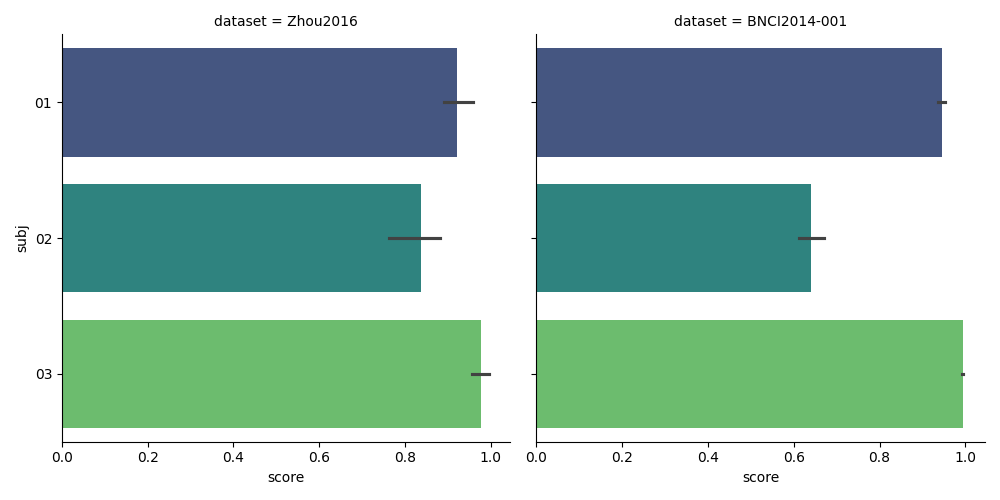
Plotting Results#
We plot the results using the seaborn library. Note how easy it is to plot the results from the three datasets with just one line.
2026-07-14 23:37:59,841 INFO MainThread matplotlib.category Using categorical units to plot a list of strings that are all parsable as floats or dates. If these strings should be plotted as numbers, cast to the appropriate data type before plotting.
2026-07-14 23:37:59,845 INFO MainThread matplotlib.category Using categorical units to plot a list of strings that are all parsable as floats or dates. If these strings should be plotted as numbers, cast to the appropriate data type before plotting.
Total running time of the script: (2 minutes 32.733 seconds)
Run this example