

Note
Go to the end to download the full example code.
Benchmarking with MOABB with Grid Search#
This example shows how to use MOABB to benchmark a set of pipelines on all available datasets. In particular we run the Gridsearch to select the best hyperparameter of some pipelines and save the gridsearch. For this example, we will use only one dataset to keep the computation time low, but this benchmark is designed to easily scale to many datasets.
# Authors: Igor Carrara <igor.carrara@inria.fr>
#
# License: BSD (3-clause)

import matplotlib.pyplot as plt

from moabb import benchmark, set_log_level
from moabb.analysis.chance_level import chance_by_chance
from moabb.analysis.plotting import score_plot
from moabb.paradigms import LeftRightImagery


set_log_level("info")
In this example, we will use only the dataset ‘Zhou 2016’.
Running the benchmark#
The benchmark is run using the benchmark function. You need to specify the
folder containing the pipelines to use, the kind of evaluation and the paradigm
to use. By default, the benchmark will use all available datasets for all
paradigms listed in the pipelines. You could restrict to specific evaluation and
paradigm using the evaluations and paradigms arguments.
To save computation time, the results are cached. If you want to re-run the
benchmark, you can set the overwrite argument to True.
It is possible to indicate the folder to cache the results and the one to save
the analysis & figures. By default, the results are saved in the results
folder, and the analysis & figures are saved in the benchmark folder.
# In the results folder we will save the gridsearch evaluation
# When write the pipeline in ylm file we need to specify the parameter that we want to test, in format
# pipeline-name__estimator-name_parameter. Note that pipeline and estimator names MUST
# be in lower case (no capital letters allowed).
# If the grid search is already implemented it will load the previous results
#
# Optional: CodeCarbon Configuration for GridSearch Benchmarks
# ~~~~~~~~~~~~~~~~~~~~~~~~~~~~~~~~~~~~~~~~~~~~~~~~~~~~~~~~~~~~
#
# Grid search can be computationally expensive. You may want to track emissions
# during the optimization process. Configure CodeCarbon as needed:
#
# .. code-block:: python
#
#     codecarbon_config = {
#         'tracking_mode': 'machine',
#         'save_to_file': True,
#         'output_file': 'gridsearch_emissions.csv',
#         'log_level': 'info'
#     }
#
# With ``tracking_mode='machine'``, CodeCarbon will track the entire machine's
# power consumption, which is useful for benchmarking.

results = benchmark(
    pipelines="./pipelines_grid/",
    evaluations=["WithinSession"],
    paradigms=["LeftRightImagery"],
    include_datasets=["Zhou2016"],
    results="./results/",
    overwrite=False,
    output="./benchmark/",
    suffix="benchmark_grid",
    plot=False,
)
The paradigms being run are dict_keys(['LeftRightImagery'])
Datasets considered for LeftRightImagery paradigm ['Zhou2016']
/home/runner/work/moabb/moabb/moabb/analysis/results.py:192: H5pyDeprecationWarning: Creating a dataset without passing data or dtype is deprecated. Pass an explicit dtype. Using dtype='f4' will keep the current default behaviour.
  dset.create_dataset(
    dataset     evaluation   pipeline  avg score  carbon emission
0  Zhou2016  WithinSession         EN   0.943825         0.302032
1  Zhou2016  WithinSession    EN Grid   0.943416         0.686410
2  Zhou2016  WithinSession  CSP + LDA   0.938120         0.458360
Benchmark prints a summary of the results. Detailed results are saved in a
pandas dataframe, and can be used to generate figures. The analysis & figures
are saved in the benchmark folder.
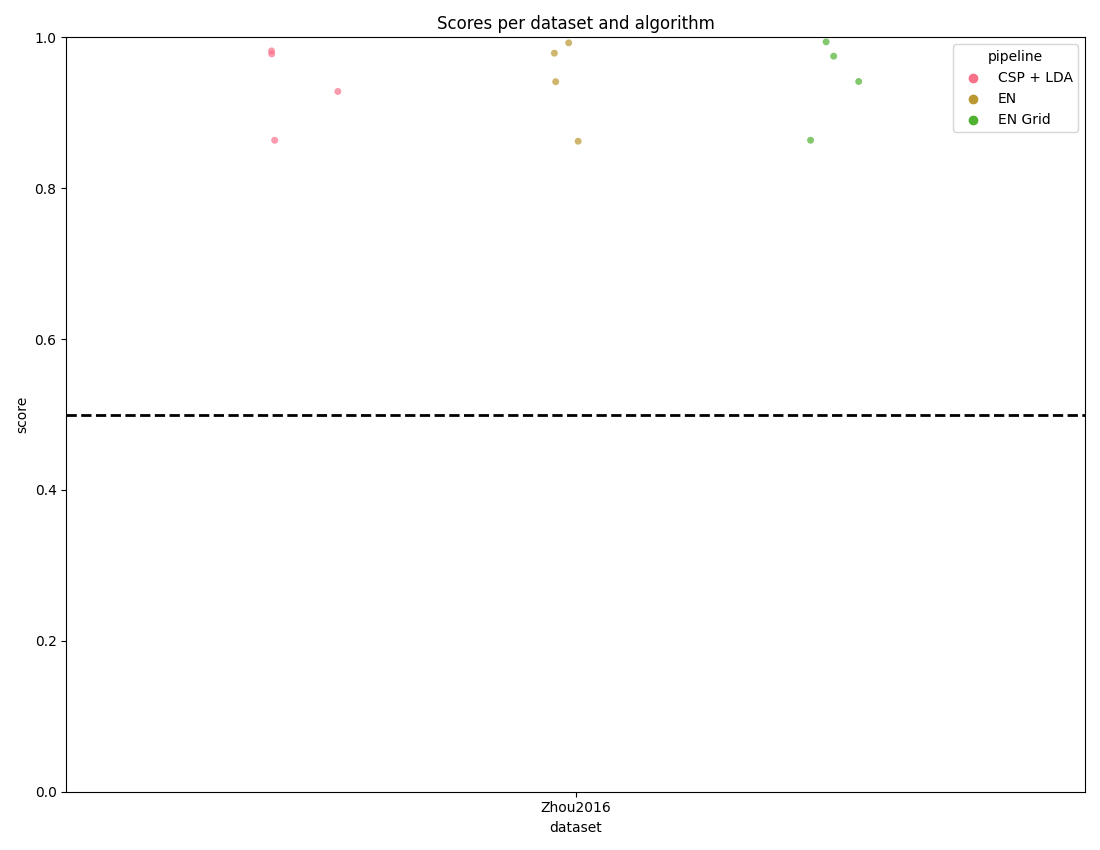
Compute chance levels for the dataset used in the benchmark.
paradigm = LeftRightImagery()
chance_levels = chance_by_chance(results, alpha=[0.05, 0.01])

score_plot(results, chance_level=chance_levels)
plt.show()
/home/runner/work/moabb/moabb/moabb/analysis/plotting.py:421: UserWarning: The palette list has more values (6) than needed (3), which may not be intended.
  sea.stripplot(
Total running time of the script: (3 minutes 3.089 seconds)
Run this example